Get 10% extra OFF on Porto Summer Sale - Use PORTOSUMMER coupon - Shop Now!
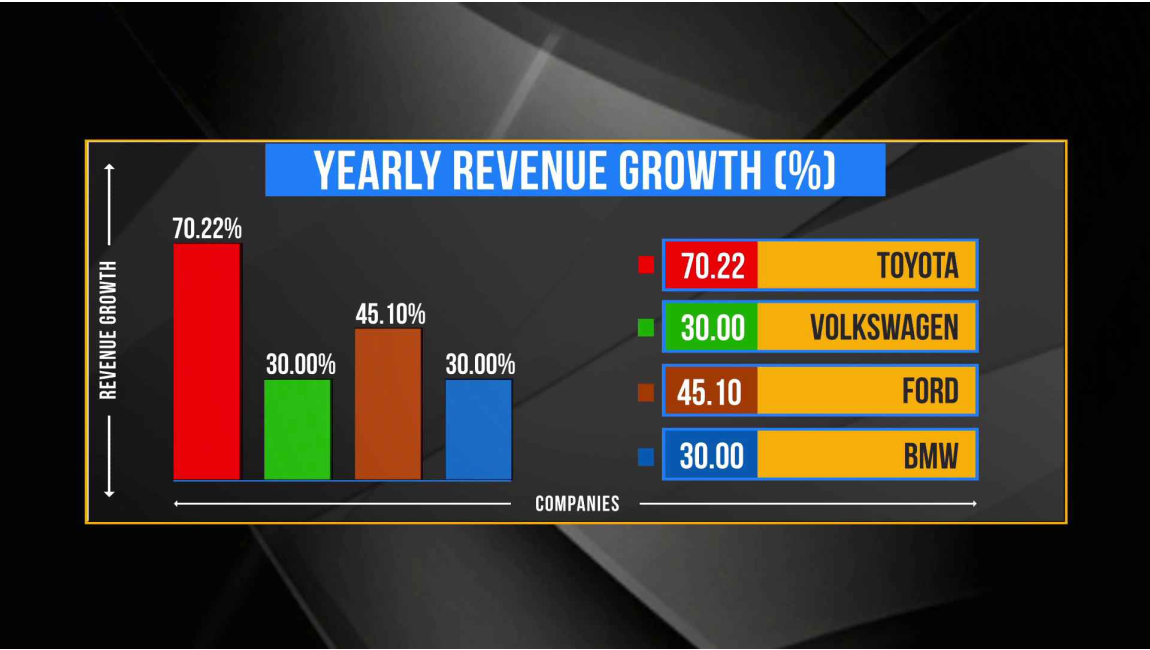
Bar Graph-4 entries
Product Attributes
| Supported Software | Xpress |
|---|---|
| Fonts Included | Yes |
| Product | Full Frame, Infographics |
| File Size | 71.5 MB |
Bring clarity to your live streams with the Bar Graph – Quad Entry Template, a dynamic infographic designed to compare four different data points in real time. Whether tracking sales performance, ranking competitors, analyzing survey responses, or displaying financial insights, this template ensures seamless, professional, and engaging data presentation.
With four bar entries displayed side by side, this template enables in-depth comparisons while maintaining a clean and easy-to-read layout. The animated transitions enhance viewer engagement, while customizable colors, fonts, and labels help align the design with your brand or theme.
Perfect for election analysis, sports leaderboards, stock market trends, poll comparisons, and performance tracking, the Bar Graph – Quad Entry Template updates automatically with live data sources. This ensures that your audience always sees the most relevant and up-to-date information.
Designed for versatility, the template supports adjustable bar sizes, transition effects, gradient fills, and data scaling, making it suitable for diverse content needs. Whether used in business presentations, esports broadcasts, financial reports, or media coverage, it provides an intuitive way to break down complex information into digestible visuals.
Upgrade your storytelling with the Bar Graph – Quad Entry Template—because real-time data deserves a dynamic and compelling display!


