Get 10% extra OFF on Porto Summer Sale - Use PORTOSUMMER coupon - Shop Now!
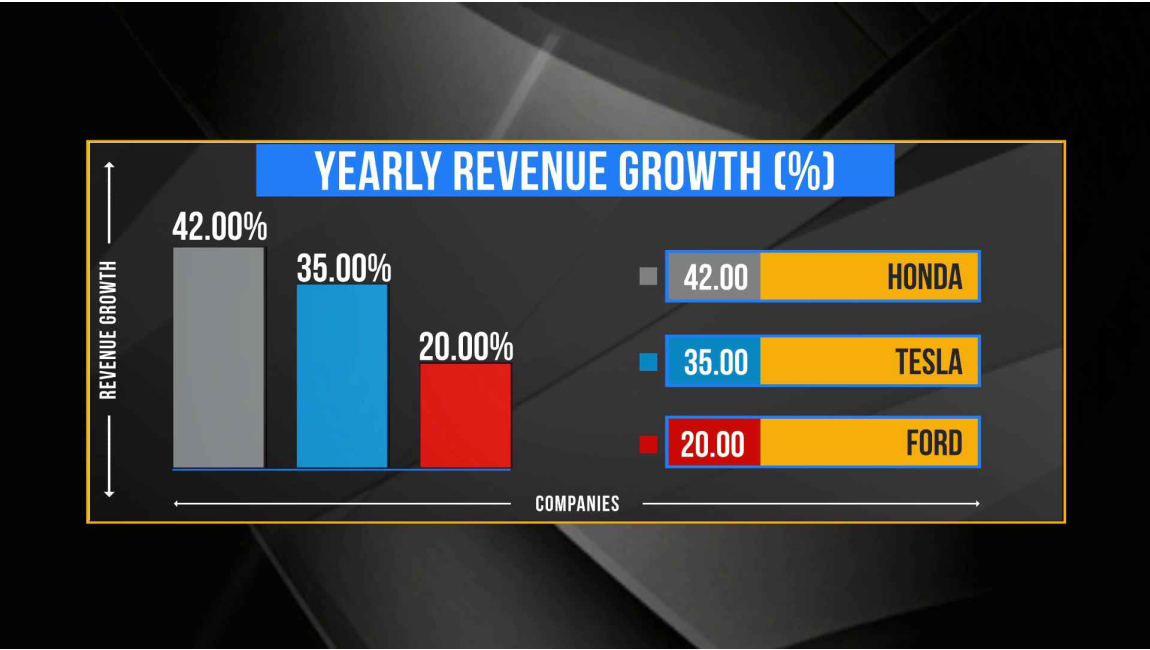
Bar Graph- 3 entries
Product Attributes
| Supported Software | Xpress |
|---|---|
| Fonts Included | Yes |
| Product | Full Frame, Infographics |
| File Size | 73.5 MB |
Make data visualization seamless and engaging with the Bar Graph – Triple Entry Template, designed to display and compare three different data sets in real-time. Whether analyzing market trends, ranking players, showcasing survey results, or presenting financial insights, this template ensures clear and dynamic data representation.
Featuring three distinct bar entries, this template allows for side-by-side comparisons with intuitive animations that enhance audience engagement. The flexible layout supports custom colors, labels, scaling, and dynamic updates, ensuring a polished and professional look that adapts to your broadcast needs.
Ideal for sports leaderboards, election coverage, financial reports, sales performance tracking, and audience polls, the Bar Graph – Triple Entry Template keeps your viewers informed with visually appealing graphics. It integrates seamlessly with real-time data sources, automatically updating values to reflect live changes.
Customization options include adjustable bar heights, transition effects, gradient fills, and text styles, allowing you to maintain consistency with your brand or theme. Whether used for corporate webinars, esports streams, or news broadcasts, this template delivers information in a clear, digestible format.
Upgrade your live streams with Bar Graph – Triple Entry Template and bring numbers to life with movement, clarity, and impact!


