Get 10% extra OFF on Porto Summer Sale - Use PORTOSUMMER coupon - Shop Now!
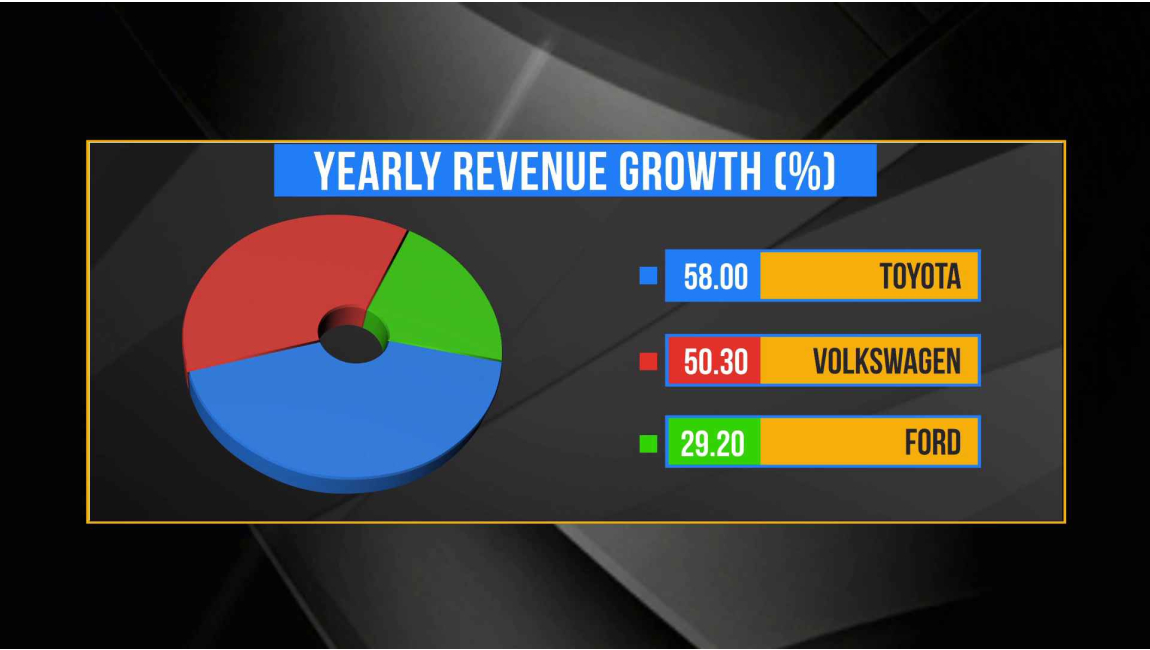
Pie Chart-3 Entries
Product Attributes
| Supported Software | Xpress |
|---|---|
| Fonts Included | Yes |
| Product | Full Frame |
| File Size | 67.8 MB |
Transform raw numbers into compelling visuals with the Quad Data Pie Chart – Live Streaming Template. Designed for professionals who need to display multiple data points clearly, this template presents four distinct data sets within a single, dynamic pie chart. Whether you’re tracking financial trends, analyzing audience demographics, presenting election results, or comparing performance metrics, this template ensures your data is engaging and easy to understand.
With smooth animations and real-time updates, the Quad Data Pie Chart seamlessly integrates into any live broadcast or virtual event. The distinct color segments allow for easy differentiation, while labels and tooltips provide detailed breakdowns of each category. This makes it an essential tool for financial analysts, news presenters, sports commentators, educators, and corporate teams looking to enhance their storytelling with data-driven insights.
Fully customizable, you can adjust colors, fonts, labels, and transitions to match your branding. The template supports real-time modifications, ensuring that your data remains up to date, even in fast-paced environments. Whether you’re showcasing stock market movements, survey results, marketing analytics, or sports statistics, this template turns data into visually compelling narratives.
Upgrade your live stream production with the Quad Data Pie Chart – Live Streaming Template—because data should be as engaging as the story it tells!


